
2026 Global Markets Outlook: Asset Allocation After the Great Disconnect
Complete 2026 investment outlook covering US equities, China, fixed income, gold, copper, and Asian insurance flows. How to position portfolios after 2025's strange year where weak economies beat strong ones.

Published January 28, 2026

In this article

Asset class and style returns. Source: J.P. Morgan AM Monthly Market Review
2025 broke the rules. Now what?
Last year, the countries with the worst fundamentals delivered the best returns. China's equities surged 33% despite negative earnings growth. Europe returned 22% on 2% earnings growth. Meanwhile, the US, with 12% earnings growth and actual economic strength, "only" returned 18%.
That's not supposed to happen. The "Great Disconnect," where multiple expansion in stagnant economies outpaced fundamental delivery in growing ones, is widely viewed as unsustainable. The consensus for 2026: mean reversion. Asset prices realign with cash flow generation, fiscal probity, and legal certainty.
Key Takeaways
- US equities remain the strategic core. S&P 500 target: 7,500. AI productivity adds 0.4% to annual GDP growth through 2035
- China is a trade, not an investment. Property sales down 42% YoY in January. Trend growth slowing to 3%, eventually underperforming US
- Fixed income faces a supply tsunami. Bear steepening likely as long-end yields rise on record sovereign issuance
- Trump v. Cook is the binary risk event of H1 2026. Fed independence at stake. Gold is the hedge
- Gold to $5,000/oz (J.P. Morgan) if institutional risks materialize. 2-5% tactical allocation as catastrophe insurance
- Copper is the growth commodity. Target $13,500/mt on AI data center buildout and supply constraints
- Asian insurance flows are shifting. Taiwan's TW-ICS reducing unhedged USD credit appetite. China households fleeing deposits for insurance
Contents
| Section | Coverage |
|---|---|
| I. Executive Summary | The Great Reversion thesis |
| II. Global Equity Arbitrage | US, China, Europe outlook |
| III. Fixed Income Markets | Fed policy, Trump v. Cook, European supply |
| IV. Asian Insurance Flows | Taiwan TW-ICS, China deposit migration |
| V. Credit Markets | IG outlook, crowding-out risk |
| VI. Commodities | Gold debate, copper thesis |
| VII. China Deep Dive | Stimulus, property, exports |
| VIII. Model Portfolio | Allocation recommendations |
| IX. Key Risks | What could go wrong |
Bottom Line Up Front
| Asset Class | Call | Target / View |
|---|---|---|
| US Equities | OW | S&P 500 to 7,500 (+13-15% EPS growth) |
| China Equities | UW | Fade rallies; trend growth to 3% |
| Europe Equities | UW | No catalyst; defense/utilities only |
| EM ex-China | OW | India, Mexico supply chain beneficiaries |
| Duration | N/UW | Bear steepening; long end vulnerable |
| IG Credit | Tactical | Buy Q1 widening |
| Gold | 2-5% | $5,000/oz catastrophe hedge |
| Copper | Long | $13,500/mt on AI buildout |
OW = Overweight, UW = Underweight, N = Neutral
Executive Summary: Navigating the Great Reversion
The global financial system is at a turning point. For fixed income managers overseeing trillions in capital, 2025 presented a confounding paradox: risk assets in regions with the weakest fundamentals significantly outperformed the United States in local currency terms, despite the latter's superior earnings growth and economic resilience.
| Market | 2025 Return | Earnings Growth | Quality of Return |
|---|---|---|---|
| United States | +18% | +12% | Fully earned (1:1 price/earnings) |
| Non-US Developed | +22% | +2% | Multiple expansion (fragile) |
| China | +33% | Negative | Policy put / short squeeze |
As we enter 2026, the macroeconomic environment is characterized by a "K-shaped" global recovery:
- United States: Economic exceptionalism continues, driven by a secular AI capex supercycle expected to contribute ~0.4% to annual productivity growth through 2035
- Eurozone: Grappling with re-industrialization friction and energy transition costs
- China: Deflationary balance sheet recession in property that fiscal "front-loading" has arguably failed to arrest
For fixed income, the regime of "higher for longer" has evolved into "supply for longer." Markets are bracing for record sovereign and corporate issuance, particularly in Europe, threatening to unmoor term premia even as central banks attempt shallow easing cycles.
The Federal Reserve is priced for ~50 basis points of cuts in 2026. But this path is jeopardized by the looming constitutional crisis of Trump v. Cook, a Supreme Court battle that threatens to dismantle the political independence of the US central bank.
Part I: The Global Equity Arbitrage
The allocation puzzle for 2026 begins with forensic accounting of 2025. Understanding why "bad news was good news" is essential to determining whether this regime persists or collapses.
1.1 Deconstructing the 2025 Anomaly
United States: Fundamental Durability
US equities returned 18% in 2025. While this trailed international peers, it was qualitatively superior because it was fully supported by earnings growth.
- Corporate earnings expanded 12%, driven by technology and resilient consumer spending
- The Magnificent Seven and broader tech ecosystem leveraged genuine cash flow expansion from early AI monetization
- The 1:1 relationship between price appreciation and earnings growth suggests the US market is not in a speculative bubble but pricing in higher prolonged growth
The performance was concentrated but rational. This wasn't multiple expansion on hope. It was multiple stability on delivery.
Non-US Developed Markets: The Multiple Expansion Trap
Non-US developed markets (primarily Europe and Japan) returned 22%, outperforming the US by 400 basis points. But decomposition reveals a fragile foundation:
- Earnings growth: 2%
- Multiple expansion: 20 percentage points
The excess return was driven almost entirely by investors paying more for the same unit of earnings. This behavior was fueled by anticipation of central bank dovishness (ECB and BOJ pivot) rather than organic corporate dynamism.
For asset managers, this signals high mean reversion risk in 2026 if anticipated monetary easing is priced out or anaemic growth turns into recession.
China: The Liquidity Flush
The most stark dislocation occurred in China, where equities returned 33% despite negative aggregate earnings growth.
This rally defies fundamental logic and bears the hallmarks of a "policy put":
- Driven by aggressive, synchronized stimulus announcements in late 2025
- Violent short-covering rallies rather than real economy recovery
- Independent estimates suggest real GDP growth was likely 1-3%, far below the official 5% target
- Earnings for the broad index were actually down for the year
The 33% return represents a re-rating from distressed levels, fueled by domestic liquidity trapped within a closed capital account, rather than restoration of economic health.
1.2 The 2026 Outlook: Return to Earnings Dominance
The strategic consensus for 2026 is rotation back to quality and earnings visibility. The "beta chase" of 2025 gives way to "alpha generation" based on secular growth drivers.
US Equities: The AI Productivity Moat
Target: S&P 500 at ~7,500 by year-end 2026 Earnings growth: 13-15%

S&P 500 technical support levels. Source: J.P. Morgan US Equity Year Ahead (Dec 2025)
The United States remains the strategic cornerstone for global portfolios. The bullish thesis rests on three pillars:
1. AI Diffusion
The benefits of AI are spreading beyond hyperscalers (Alphabet, Microsoft, Amazon) to "AI Adopters" in healthcare, industrials, and financials. Companies like Eli Lilly and Boston Scientific are highlighted as beneficiaries where AI accelerates drug discovery and operational efficiency.
2. Productivity Growth
Goldman Sachs estimates AI adoption will add 0.4% to annualized US productivity growth, raising potential GDP trend to 2.4% through 2035. This productivity boost allows the economy to run hotter without triggering wage-price spirals that plagued the post-COVID era.
3. Capital Return
US corporates continue returning capital to shareholders at record rates. Buybacks provide a steady bid for equities, acting as a buffer against volatility.
Verdict: Overweight. Focus on companies with high ROIC and AI leverage: semiconductors, software, healthcare.
China: Secular Deceleration and the Value Trap
Outlook: Negative to Neutral
The "sugar rush" of stimulus is fading, revealing deep structural scars.
Growth Projections:
- Trend growth projected to slow to 3% over the next decade
- 2% by 2035, eventually underperforming the US trend
- This inversion of growth differentials removes the primary argument for EM allocations to China
Sectoral Divergence:
- Exports remain resilient due to global demand
- Domestic property sector (70% of household wealth) remains in depression
- Commodity property sales fell 41.8% year-over-year in first two weeks of January 2026
- This signals the bottom has not been reached
Verdict: China is increasingly a trading vehicle rather than a core holding. Fade rallies. Use liquidity events to reduce exposure. Reallocate to Emerging Markets ex-China (India, Mexico) which benefit from supply chain diversification.
Eurozone: The Search for a Catalyst
Expected return: ~6% in 2026, lagging both US and EM
The region suffers from lack of exposure to the dominant theme of the decade: technology and AI. Europe remains heavily weighted towards cyclical "old economy" sectors like banking and industrials.
While valuations are low, they're "fair" given lack of earnings momentum. However, specific opportunities exist in European defense and select industrials benefiting from the re-armament cycle.
Verdict: Underweight. Selective opportunities in defense and utilities.
Part II: Fixed Income Markets
The fixed income landscape for 2026 is defined by collision between benign economic data (soft landing) and malignant technical/institutional factors (supply glut and governance risks).
2.1 The Federal Reserve: Pricing the Shallow Cut
Markets enter 2026 pricing a "Goldilocks" scenario for credit but a restrictive one for rates.

10-year Treasury yields vs. forward OIS rates. Source: J.P. Morgan US Equity Year Ahead (Dec 2025)
The Path:
- Fed forwards discount ~50 basis points of cuts in 2026, likely Q1 and Q2
- Reflects a central bank calibrating policy to a neutral rate structurally higher than pre-2020
The Curve:
- Consensus trade: bear steepening
- Short-end rates anchored by Fed's pause/cut cycle
- Long end (10Y and 30Y) faces upward pressure from resilient growth expectations and fiscal issuance
- US Treasuries have richened against SOFR to their tightest levels in two years
- The valuation buffer in high-quality liquid assets (HQLA) has eroded
2.2 The Institutional Tail Risk: Trump v. Cook
A profound, non-linear risk hangs over the US Treasury market in Q1 2026: the Supreme Court case regarding removability of Federal Reserve Governors.
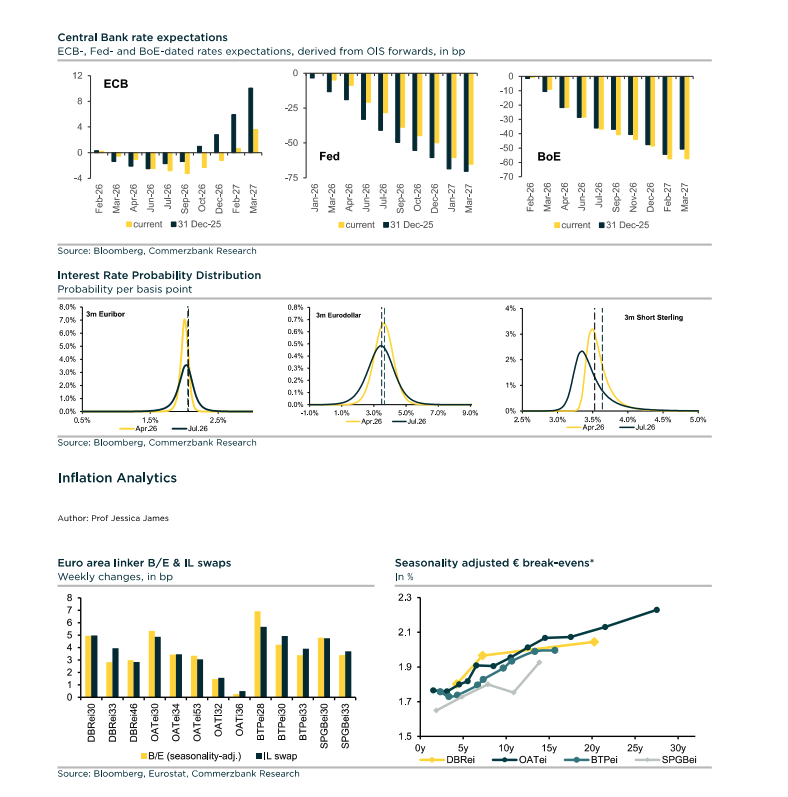
Interest rate probability distributions for 2026. Source: Commerzbank Ahead of the Curve (Jan 2026)
Legal Context:
In Trump v. Cook, the Supreme Court will decide whether the President can fire Fed Governor Lisa Cook for policy disagreements (framed as "inefficiency"). Oral arguments in January 2026 suggest a divided court, with institutionalists wary of shattering Fed independence.
The "Eccles" Precedent:
Historical parallel to 1948, where Marriner Eccles remained on the Board after his Chairmanship ended to preserve continuity. Similarly, Chair Powell's term as Chair ends in May 2026, but his Governor term extends to 2028. If the Court rules against Cook, it opens the door for complete reshaping of the FOMC by the executive branch.
Market Implications:
A ruling that erodes Fed independence would likely trigger:
- Immediate spike in term premia
- Higher compensation demanded for holding long-dated US debt
- Increased risk of politically motivated monetization or inflation
- This is a binary risk event that cannot be modeled with standard deviation
- Requires convex hedging strategies: long gold, long TIPS
2.3 European Sovereign Debt: Managing the Deluge
Europe faces a test of market depth in early 2026.

Euro benchmark issuance towering over historical averages. Source: Commerzbank Credit Rates Outlook (Jan 2026)
Issuance Calendar:
- January 2026 projected to set records for gross issuance
- European Government Bond (EGB) market alone: EUR 26 billion from five sovereigns in opening weeks
The "Buxl" Distortion:
- Technical factors driving idiosyncratic risks in the German curve
- Cheapest-to-deliver (CTD) switch in 30-year Buxl futures creating volatility in the long end
- Detaching futures prices from physical cash bond market
- Sophisticated managers arbitraging this basis
Spread Dynamics:
- Despite supply, peripheral spreads (Italy-Germany) remain tight, supported by "Goldilocks" credit sentiment
- Sheer volume of high-grade supply (SSAs and EGBs) creates crowding-out effect
- Analysts expect short-lived widening, creating tactical entry point for Corporate Investment Grade credit later in Q1 once "indigestion" clears
Fixed Income Verdict:
- Duration neutral to underweight (bear steepening risk)
- Curve steepeners: long 2Y / short 10Y or 30Y
- Overweight TIPS for cheap inflation optionality
Part III: Asian Markets & Insurance Flows
For global asset managers, Asian insurance flows are a critical, often overlooked driver of global bond yields. In 2026, regulatory changes and asset-liability management shifts in Asia will ripple through global credit markets.
3.1 The Taiwan Bid: TW-ICS and FX Volatility
Taiwanese life insurers, historically among the largest buyers of US corporate credit, are undergoing a regime shift.
Regulatory Change:
- Implementation of new solvency framework (TW-ICS)
- Revised FX accounting rules reducing appetite for unhedged foreign currency risk
- Suggests structural reduction in the "blind" bid for US credit from Taiwan
- Potentially widening US IG spreads at the margin
Yield Targets:
- Dividend yields for Taiwanese insurers forecast at 4.2% in 2026
- Institutions prioritizing capital preservation and reduced volatility over yield chasing
- Taiwanese insurers (KGI, Cathay) favored over Korean peers due to improved capital clarity
3.2 China: The Shift to "Risk-Free" Liabilities
A profound behavioral shift is occurring in Chinese household finance.
Deposit Migration:
- Households moving savings from low-yielding bank deposits into life insurance policies
- Perceived as "risk-free" alternatives
- Massive inflow lowering liability funding costs for Chinese insurers
- Creating surge in demand for domestic long-duration assets (CGBs) to match liabilities
Market Impact:
- Structural cap on Chinese government bond yields, even as fiscal issuance rises
- Self-reinforcing loop: deflationary pressures drive capital into fixed income, suppressing yields
- Limits transmission of monetary stimulus to real economy
Equity Implication:
- Supports valuation case for Chinese insurers: China Life-H, Ping An-H
- New Business Value (NBV) growth of 15-22% driven by volume, even as margins compress
Part IV: Credit Markets
The corporate credit outlook for 2026 is defined by resilience. The widely feared "maturity wall" of 2025 has been largely navigated, leaving healthy balance sheets but tight valuations.
4.1 US Investment Grade: The Safe Harbor
Issuance Outlook:
- Heavy issuance expected in January as treasurers lock in rates ahead of potential volatility
- Demand technicals remain robust
Fundamentals:
- Corporate leverage ratios stable
- Interest coverage ratios, while lower than 2021 peaks, remain well above historical distress levels
- Corporate Investment Grade (CIG) segment is the sweet spot for 2026 allocations
- Attractive all-in yields with minimal default risk
Sector Selection:
- Utilities: powering AI data centers
- Financials: benefiting from steeper curve
4.2 The "Crowding Out" Risk
The primary risk to credit spreads in 2026 is not default, but supply.
The deluge of sovereign issuance (Treasuries and EGBs) competes for the same pool of fixed-income capital. If term premia on sovereigns rise significantly (due to Trump v. Cook or fiscal deficits), IG credit spreads will need to widen to maintain relative attractiveness.
Expectation: Short-lived widening events in Q1 that should be bought.
Part V: Commodities
The commodities complex offers the most divergent views for 2026, splitting between financial modeling and geopolitical realism.
5.1 The Great Gold Debate: Model vs. Reality
Asset managers face two diametrically opposed frameworks for valuing gold in 2026.
The Bearish Strategic View (Goldman Sachs ISG)
Thesis: Gold is a non-yielding asset that historically fails as a consistent inflation hedge (50% success rate vs. 100% for equities). In a world of positive real rates and robust US growth, the opportunity cost of holding gold is prohibitive.
Conclusion: Current price strength is "tactical," driven by central bank buying that puts a floor under price but doesn't justify strategic overweight. US Treasuries are the superior "sleep well" asset for deflationary hedging.
The Bullish Tactical View (J.P. Morgan)
Thesis: Gold is in a structural bull market. Target: $5,000/oz by Q4 2026
Drivers:
- Weaponization of USD and sanctions risk forcing central banks (PBoC, Russia, Global South) to diversify reserves into gold
- Price-insensitive bid from reserve managers
- Gold acts as the only hedge against "fiscal dominance": a scenario where Fed loses independence and monetizes deficits
Synthesis: Our View
For a risk manager, the J.P. Morgan view offers "catastrophe insurance."
If Trump v. Cook erodes Fed credibility, the correlation between stocks and bonds could turn positive (both fall), leaving gold as the only diversifier.
Verdict: 2-5% tactical allocation as catastrophe insurance. The premium is worth paying.
5.2 Copper: The Physical Reality of AI
Unlike gold, the bullish case for copper is based on physical scarcity and industrial necessity.

Industrial metals breakout pattern. Source: J.P. Morgan US Equity Year Ahead (Dec 2025)
The AI Energy Tax:
- AI data centers are immensely energy-intensive
- Grid buildout to support this load requires massive copper
Supply Deficit:
- Mine supply constrained by underinvestment
- Resource nationalism in Latin America limiting new projects
Target: Copper prices forecast to rise toward $13,500/mt in 2026
Copper is the "growth" commodity, highly correlated with the US productivity thesis. Long copper captures the AI story through a different channel than semiconductors.
Verdict: Structural long position.
Part VI: The Chinese Economy Deep Dive
Analyzing China in 2026 requires looking past headline GDP figures to high-frequency industrial data.
6.1 The "Front-Loaded" Stimulus
The Chinese government initiated 2026 with "front-loaded" fiscal push to prevent hard landing.

Government bond issuance: 2025 vs 2026. Source: Huatai Securities China Economy Pulse Check (Jan 2026)
Bond Issuance (First 15 Days of January):
- Government bond issuance: +RMB 53.5 billion YoY
- Total bond issuance (sovereign + local): +RMB 108.6 billion
Real Economy Impact:
- Stimulus showing up in "old economy" metrics
- Cement plant operating rates: +7.1 percentage points YoY
- Asphalt shipments: +16.5% YoY
- Confirms government reverting to infrastructure spending to floor growth
6.2 The Property Black Hole
Despite monetary easing (lower down payments, rate cuts), the property sector remains in freefall.

Commodity property sales collapse: -41.8% YoY. Source: Huatai Securities China Economy Pulse Check (Jan 2026)
Sales Data:
- Commodity property sales: -41.8% YoY in first two weeks of January 2026
- Acceleration in decline (worse than December 2025)
- Indicates complete collapse in buyer psychology
Implication:
- As long as property (25-30% of GDP) contracts, growth in manufacturing or exports merely offsets drag
- Supports "underweight" equity stance
6.3 Exports: The Lone Bright Spot
Exports remain the sole engine of growth, supported by global AI demand and re-industrialization.
Resilience:
- Despite shorter working month, exports remain buoyant
- Global manufacturing PMI in expansion territory for five consecutive months
- Supporting demand for Chinese capital goods
Pre-emptive Flows:
- Evidence of "front-running" trade wars
- Battery and PV manufacturers surging exports ahead of anticipated tariff hikes or tax rebate cuts
Part VII: Strategic Roadmap and Model Portfolio Allocations
Based on synthesis of these divergent trends, the following allocations are recommended for institutional portfolios in 2026.
7.1 Equity Allocation: The "US Quality" Bias
| Region | Weight | Conviction | Rationale |
|---|---|---|---|
| US (S&P 500) | Overweight | High | Target 7,500. High ROIC, AI leverage. Semiconductors, software, healthcare |
| China | Underweight | High | Structural headwinds. Use stimulus rallies to exit. Demographics and debt deleveraging too potent |
| EM ex-China | Select Overweight | Medium | India, Mexico capture supply chain diversification theme |
| Europe | Underweight | Medium | No catalyst. Selective defense/utilities only |
7.2 Fixed Income Allocation: Steepeners and TIPS
| Position | Weight | Conviction | Rationale |
|---|---|---|---|
| Duration | Neutral/Underweight | High | Bear steepening risk from Trump v. Cook and fiscal supply |
| Curve Steepeners | Overweight | High | Long 2Y / Short 10Y or 30Y. Front end anchored, long end vulnerable |
| TIPS | Overweight | Medium | Cheap optionality if tariffs or Fed politicization reignite inflation |
| IG Credit | Tactical | Medium | Wait for Q1 supply indigestion, then add on widening |
7.3 Commodities & Alternatives
| Asset | Position | Target | Conviction | Rationale |
|---|---|---|---|---|
| Gold | 2-5% Tactical | $5,000/oz | Medium | Hedge against Fed independence erosion. Catastrophe insurance |
| Copper | Structural Long | $13,500/mt | High | AI infrastructure buildout. Physical scarcity |
Key Risks to Our View
Every outlook carries embedded assumptions that may prove incorrect. Intellectual honesty demands we articulate what could invalidate our thesis.
Risks to the Bullish US View
| Risk | Probability | Impact | Hedge |
|---|---|---|---|
| AI capex cycle disappoints | Low | High | Reduce tech overweight; rotate to defensives |
| Inflation re-accelerates | Medium | High | TIPS, gold, commodity exposure |
| Consumer credit deterioration | Medium | Medium | Reduce discretionary; favor staples |
| Valuation compression | Medium | Medium | Quality factor tilt; high FCF yield |
Risks to the Bearish China View
| Risk | Probability | Impact | Hedge |
|---|---|---|---|
| "Bazooka" stimulus exceeds expectations | Low | High | Tactical China exposure via options |
| Property stabilizes faster than expected | Low | Medium | EM ex-China may lag if China rallies |
| US-China détente on tariffs | Low | Medium | Export-oriented China names outperform |
Tail Risks (Low Probability, High Impact)
- Trump v. Cook rules against Fed independence: Immediate repricing of all USD assets. Gold surges. Long-end yields spike 50-100bps.
- Geopolitical escalation (Taiwan Strait): Risk-off across all Asian assets. Flight to USD and gold. Copper supply disruption.
- US recession (hard landing): Credit spreads widen 200bps+. Equities down 20-30%. Duration outperforms.
Conclusion: The Age of Dispersion
The defining characteristic of 2026 will be dispersion. The synchronized moves of the post-COVID era are over.
We're entering a period where:
- US equities may rise while Chinese equities fall
- Short-term rates fall while long-term rates rise
- Commodities diverge based on utility (copper) vs. monetary role (gold)
For asset managers, generating alpha will require aggressively playing these divergences rather than relying on passive beta.
The "Great Disconnect" of 2025 is resolving. Markets are returning to a world where earnings matter, legal institutions matter, and the cost of capital is real.
Frequently Asked Questions
Why did China outperform the US in 2025 despite weaker fundamentals?
China's 33% equity return in 2025 was driven by multiple expansion and short-covering, not earnings growth. Domestic liquidity trapped in a closed capital account, combined with aggressive stimulus announcements, created a rally from distressed valuations. Actual earnings were negative for the year. The 33% represents re-rating from distressed levels, not restored economic health. This type of return is unsustainable without fundamental improvement.
What is Trump v. Cook and why does it matter for markets?
Trump v. Cook is a Supreme Court case determining whether the President can fire Federal Reserve governors for policy disagreements. Oral arguments in January 2026 suggest a divided court. A ruling against Fed independence would trigger a spike in long-term Treasury yields as investors demand higher compensation for political monetization risk. Chair Powell's term ends May 2026, but his Governor term extends to 2028. An adverse ruling opens the door to complete FOMC reshaping.
Should I buy gold or Treasuries as a safe haven in 2026?
It depends on what you're hedging. Treasuries protect against deflation and recession. Gold has only 50% success as an inflation hedge, but it's the only asset that protects against institutional degradation and fiscal dominance. If the Fed loses independence, stocks and bonds may correlate positive (both falling), making gold the only effective diversifier. A 2-5% gold allocation provides catastrophe insurance for scenarios Treasuries cannot hedge.
What is the outlook for copper prices in 2026?
Copper is expected to rise toward $13,500/mt in 2026. The bull case rests on physical scarcity: AI data centers require massive electrical grid buildout, which demands copper. Mine supply is constrained by underinvestment and resource nationalism in Latin America. Copper is the "growth" commodity highly correlated with the US productivity thesis. It captures the AI story through a different channel than semiconductors.
Why is China property still falling despite stimulus?
Despite monetary easing (lower down payments, rate cuts), property sales fell 41.8% YoY in first two weeks of January 2026, an acceleration from December. Buyer psychology has collapsed. The property sector represents 25-30% of GDP and 70% of household wealth. Government stimulus is showing up in "old economy" metrics (cement +7.1pp, asphalt +16.5%), but this merely offsets the property drag rather than generating net growth. The bottom has not been reached.
What is the S&P 500 target for 2026?
J.P. Morgan forecasts S&P 500 at approximately 7,500 by year-end 2026, supported by 13-15% earnings growth. The bull case rests on: (1) AI diffusion beyond hyperscalers to healthcare, industrials, financials; (2) productivity gains adding 0.4% to annual GDP growth through 2035; (3) continued corporate capital return via buybacks providing structural bid.
How are Asian insurance flows affecting global bond markets?
Taiwanese life insurers, historically among the largest buyers of US corporate credit, are reducing unhedged USD exposure due to new TW-ICS solvency rules. This structural reduction in the "blind" bid for US credit may widen spreads at the margin. Meanwhile, Chinese households are fleeing low-yielding deposits for insurance products, creating surge demand for domestic CGBs that caps yields even as fiscal issuance rises.
What is the "bear steepening" trade and why is it consensus?
Bear steepening means short-term rates fall (or stay flat) while long-term rates rise. It's consensus for 2026 because: (1) the Fed is expected to cut ~50bps, anchoring the front end; (2) fiscal issuance and potential Trump v. Cook ruling create term premium risk on the long end; (3) resilient US growth keeps long-end yields elevated. The trade is: long 2-year Treasuries, short 10-year or 30-year.
Sources & Methodology
Data Sources
This analysis synthesizes research from leading institutional sources:
- Goldman Sachs Global Investment Research
- J.P. Morgan Asset Management
- Federal Reserve Economic Data (FRED)
- National Bureau of Statistics of China
- European Central Bank
- Huatai Securities Research
- Commerzbank Economic Research
Methodology
This outlook was constructed using a multi-factor framework:
- Macro Regime Identification: Classification of current environment using growth, inflation, and policy variables
- Earnings Quality Decomposition: Attribution of 2025 returns to earnings growth vs. multiple expansion
- Flow Analysis: Tracking of institutional positioning, insurance flows, and central bank reserves
- Scenario Modeling: Probability-weighted outcomes for key binary events (Trump v. Cook, China stimulus)
- Cross-Asset Consistency: Ensuring equity, fixed income, and commodity views are internally coherent
Anwaar Malik
This research is powered by AllMind. This analysis was synthesized using our deep research engine, which processes institutional research, central bank communications, earnings transcripts, and macroeconomic data to surface actionable investment insights.
Disclaimer
This report is provided for informational purposes only and does not constitute investment advice, an offer to sell, or a solicitation of an offer to buy any securities. The views expressed represent the author's opinions as of the publication date and are subject to change without notice.
Past performance is not indicative of future results. All investments involve risk, including possible loss of principal. The information contained herein has been obtained from sources believed to be reliable, but accuracy cannot be guaranteed.
This analysis may contain forward-looking statements that involve risks and uncertainties. Actual results may differ materially from those projected. Readers should conduct their own due diligence and consult with qualified financial advisors before making investment decisions.
AllMind and the author may hold positions in securities mentioned in this report.